
What Are Westgard Rules? A Complete Guide to Internal Quality Control and Levey–Jennings Charts

What are Westgard Rules? Westgard Rules are a set of standard statistical rules used to interpret internal quality control results on a Levey–Jennings chart. These rules help laboratories detect random, systematic, and trend-related errors before patient results are reported. In this article, we explain the concept of Internal Quality Control, how to create a Levey–Jennings chart using a real dataset, how to calculate mean and standard deviation in Excel, and then review all Westgard Rules in a practical and analytical way.
What Are Westgard Rules? A Complete Guide to Internal Quality Control and Levey–Jennings Charts
To join our educational Telegram channel, please visit the link below:
https://t.me/heamostica
Table of Contents: What Are Westgard Rules?
- 1. Introduction: Why Are Internal Quality Control and Westgard Rules Important?
- 2. What Is Internal Quality Control (IQC) and What Are Its Goals?
- 3. What Is a Levey–Jennings Chart and What Are Its Components?
- 4. Real Glucose Control Dataset and Calculation of Mean and SD in Excel
- 5. A Comprehensive Introduction to Westgard Rules in Internal Quality Control
- 6. Complete Explanation of Westgard Rules (1-2s, 1-3s, 2-2s, R-4s, 4-1s, and More)
- 7. Practical Summary: How to Use Westgard Rules in the Laboratory
- Frequently Asked Questions About Westgard Rules
- Reliable References for Further Study on Westgard Rules
1. Introduction: Why Is Knowing What Westgard Rules Are Essential for Every Laboratory?
In every medical diagnostic laboratory, the reliability of test results is the most important scientific and professional asset. Even the smallest analytical error can lead to misdiagnosis, inappropriate treatment selection, or delayed clinical decision-making. For this reason, laboratories are required to operate according to the principles of a Quality Management System (QMS). One of the main pillars of this system is Quality Control (QC).
At the heart of quality control lies a key question: Are the results obtained from the analyzer today consistent with previous days and with the true value in terms of precision and accuracy? To answer this question, laboratories use Internal Quality Control (IQC). The results of these controls are plotted on a chart called the Levey–Jennings Chart and then interpreted using a set of statistical rules known as Westgard Rules.
When we ask “What are Westgard Rules?”, we are actually looking for a standard and globally accepted method for early detection of random, systematic, and trend-related errors (Trend/Shift) in the laboratory system. A precise understanding of these rules and their correct application distinguishes a laboratory that merely “performs tests” from a laboratory that actively “manages quality.”
✅ Important note: Westgard Rules are not just a set of formulas; they are the common language of quality control worldwide. Any professional laboratory that aims to work according to international standards must understand what Westgard Rules are and how to apply them to the Levey–Jennings chart.
2. What Is Internal Quality Control (IQC)?
Internal Quality Control (IQC) is a process performed within the laboratory on a daily basis or for each analytical run to ensure the stable performance of the analyzer, kit, reagent, and operator over time. In this process, control serum samples with known assigned values are used, usually at a minimum of two levels: normal and pathological. These samples are measured by the analyzer just like patient samples, but their purpose is not clinical reporting; their purpose is to evaluate the accuracy and precision of the analytical system.
The main goals of internal quality control include:
- Assessment of precision: Are repeated results for a control sample across different days and analytical runs close to each other, or do they show high dispersion?
- Assessment of accuracy: Is the mean of the control results close to the assigned value, or is there a constant shift or bias?
IQC results are recorded over time and plotted on a Levey–Jennings chart. Then, using Westgard Rules, the laboratory decides whether the analytical run is acceptable or should be rejected and investigated for the cause of error.
✅ Key point in learning Westgard Rules: Without correct execution of internal quality control and regular plotting of results on the chart, even the best statistical rules will not be effective. Westgard Rules must be understood within the context of IQC, not separately from it.
For comprehensive study of quality control in different laboratory departments, please visit the links below:
3. What Is a Levey–Jennings Chart and How Is It Related to Westgard Rules?
The Levey–Jennings Chart is a standard line chart used to display and monitor changes in internal quality control results over time. This chart was introduced by Levey and Jennings in the 1950s and is now recognized worldwide as the main tool for monitoring quality control. For a comprehensive guide on creating a Levey–Jennings chart in Excel, please visit the following link:
رسم نمودار لوی جنینگ در اکسل | آموزش کامل کنترل کیفی در آزمایشگاه
A correct understanding of the Levey–Jennings chart is an important prerequisite for understanding what Westgard Rules are and how they should be applied to data, because all Westgard Rules are defined based on the pattern of control points on this chart.
3.1. Components of a Levey–Jennings Chart in Internal Quality Control
A Levey–Jennings chart usually includes the following components:
- Horizontal axis (X-axis): Day number, control date, or quality control run number.
- Vertical axis (Y-axis): Measured value of the control sample, such as glucose concentration.
- Central line (Mean Line): The mean of control results, used as the reference point.
- Standard deviation lines (SD Lines): Horizontal lines at Mean ± 1SD, Mean ± 2SD, and Mean ± 3SD, which act as warning and rejection limits.
In practice, the control value for each day is plotted on this chart and the points are connected. The pattern of movement of these points, whether scattered, clustered, trending, or showing a collective shift, helps determine whether the system is operating normally or whether an error is occurring.
✅ Why do we need a Levey–Jennings chart to interpret Westgard Rules?
Westgard Rules are essentially specific patterns of control point positions relative to the mean and SD lines. Therefore, without a Levey–Jennings chart, practical application of these rules is not possible.
4. Real Glucose Control Dataset and Calculation of Mean and SD in Excel
To make the training on Westgard Rules and the Levey–Jennings chart practical and applicable, we use a real internal quality control dataset for serum glucose at the normal level. Suppose you measured the glucose control sample for 20 consecutive days:
4.1. Real Glucose Control Dataset (IQC)
| Day | Glucose Control Result (mg/dL) |
|---|---|
| 1 | 101 |
| 2 | 103 |
| 3 | 99 |
| 4 | 102 |
| 5 | 100 |
| 6 | 104 |
| 7 | 102 |
| 8 | 101 |
| 9 | 105 |
| 10 | 103 |
| 11 | 102 |
| 12 | 99 |
| 13 | 100 |
| 14 | 101 |
| 15 | 104 |
| 16 | 103 |
| 17 | 102 |
| 18 | 105 |
| 19 | 100 |
| 20 | 99 |
4.2. Calculating the Mean in Excel – Step by Step
1. In Excel, enter the “Day” values from 1 to 20 in column A and the glucose values in column B from B2 to B21.
2. In cell E1, write: Mean.
3. In cell E2, enter the following formula:
=AVERAGE(B2:B21)
After running this formula, the mean of the control results is calculated. For this dataset, it is approximately 101.75 mg/dL.
4.3. Calculating Standard Deviation (SD) in Excel
1. In cell F1, write: SD.
2. In cell F2, enter the following formula:
=STDEV.S(B2:B21)
This formula calculates the sample standard deviation. For the dataset above, the SD is approximately 1.92 mg/dL.
4.4. Calculating CV% and the ±1SD, ±2SD, and ±3SD Limits
1. In cell G1, write: CV%, and in cell G2, enter the following formula:
=(F2/E2)*100
This value shows the coefficient of variation as a percentage. In this example, it is approximately 1.8–2%, which is acceptable for many clinical chemistry tests.
Then, to calculate the Mean ± SD limits:
- In E4, write +1SD, and in F4, enter:
=E2+F2 - In E5, write -1SD, and in F5, enter:
=E2-F2 - In E6, write +2SD, and in F6, enter:
=E2+2*F2 - In E7, write -2SD, and in F7, enter:
=E2-2*F2 - In E8, write +3SD, and in F8, enter:
=E2+3*F2 - In E9, write -3SD, and in F9, enter:
=E2-3*F2
✅ Important point in learning Westgard Rules:
Until the mean, SD, and statistical lines are correctly calculated and plotted on the Levey–Jennings chart, interpretation of Westgard Rules such as 1-2s, 1-3s, 2-2s, and others will not be meaningful.
5. A Comprehensive Introduction to Westgard Rules in Internal Quality Control
Westgard Rules are a set of statistical rules introduced in 1981 by Dr. James Westgard for interpreting internal quality control results on the Levey–Jennings chart. These rules help determine when control results are acceptable and when an analytical run should be rejected.
When we want to understand what Westgard Rules are, we are actually talking about a set of patterns defined based on the position of control points relative to the mean and SD lines. Each rule targets a specific type of error:
- Random Errors: These usually appear as sudden dispersion or a single point that is far from the others, such as the 1-3s or R-4s rule.
- Systematic Errors/Bias: These appear as a collective shift of results to one side of the mean or as a gradual increase or decrease in results, such as the 2-2s, 4-1s, 8x, 10x, and 7T rules.
Any laboratory aiming to align with international standards must understand these rules, know what each Westgard Rule means, identify when each rule is triggered, and make decisions about accepting or rejecting QC results accordingly.
6. Complete Explanation of Westgard Rules and the Meaning of Each Rule
In this section, we review all major Westgard Rules along with their definitions, error types, required actions, and numerical examples so that you can apply these rules in internal quality control practice.
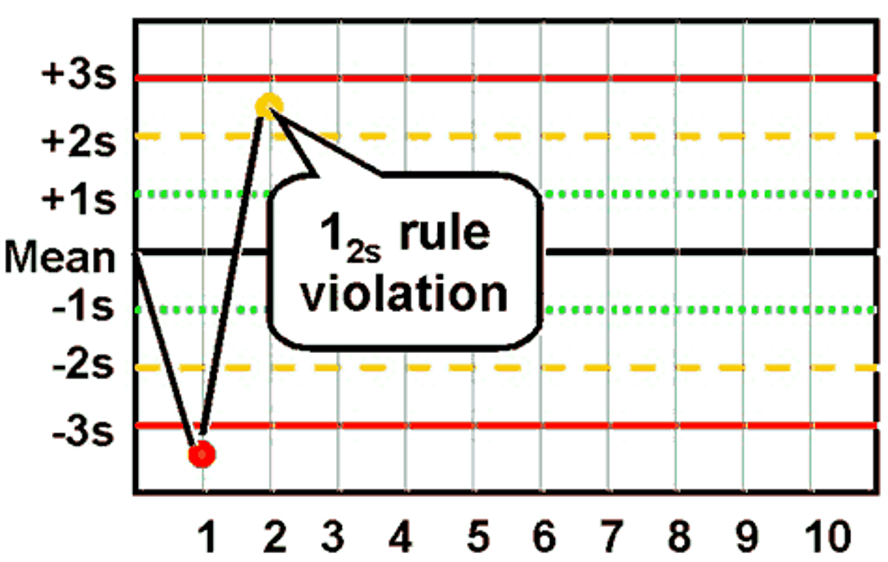
6.1. The 1-2s Rule: The Initial Warning Rule in Westgard Rules
Definition: If one control result exceeds the ±2SD limit, the 1-2s rule is triggered.
Type of rule: Warning rule, not necessarily a rejection rule.
Interpretation: A mild random error may be present, but this rule alone is not sufficient to reject the entire analytical run.
Example: If Mean = 101.75 and SD = 1.92, the 2SD range is approximately 97.9 to 105.6. If the control value on one day is 106.2, it is above +2SD, and the 1-2s rule is triggered as a warning. Subsequent controls should be evaluated more carefully.
6.2. The 1-3s Rule: Severe Random Error
Definition: This rule is triggered when one control result exceeds the ±3SD limit.
Type of error: Severe random error.
Action: Reject the analytical run and investigate the analyzer, pipette, sample, and operator.
Example: If the 3SD limits are approximately 96 to 107.5 and one day the control result is reported as 109, the 1-3s rule is triggered and the run must be rejected.
6.3. The 2-2s Rule: Detection of Systematic Error
Definition: Two consecutive control results, either at the same control level or across two different levels, are on the same side of the mean and both exceed ±2SD.
Type of error: Systematic error (Bias).
Action: Reject the run and investigate calibration, reagents, and analyzer condition.
Example: Day 10: control = 106, above +2SD, and day 11: control = 105.8, again above +2SD. In this case, the 2-2s rule is triggered and indicates a positive bias.
6.4. The R-4s Rule: A Difference of 4 Standard Deviations
Definition: In a single analytical run, the difference between two control results, such as normal and pathological controls, is greater than 4SD, with one result above the mean and the other below the mean.
Type of error: Random error.
Action: Reject the run and investigate pipetting, sample handling, and operator-related issues.
Example: If the normal control is at +2.3SD and the pathological control is at -2.1SD, the difference between them is about 4.4SD; therefore, the R-4s rule is triggered.
6.5. The 4-1s Rule: Mild and Persistent Systematic Error
Definition: Four consecutive control results are all on the same side of the mean, and each is greater than ±1SD.
Type of error: Systematic error.
Action: Investigate reagents, calibration, and environmental conditions.
Example: Four consecutive days show control results of +1.2SD, +1.3SD, +1.4SD, and +1.5SD. The 4-1s rule is triggered and indicates a persistent positive bias.
6.6. The 3 1s Rule: Three Consecutive Results Outside ±1SD
Definition: Three consecutive control results are on the same side of the mean and all exceed ±1SD.
Type of error: Mild systematic error.
Action: Serious warning; the overall chart trend should be reviewed and recalibration may be required.
6.7. The 2 of 3 2s Rule: Two of Three Results Exceed 2SD
Definition: Among three consecutive control results, two results are on the same side of the mean and exceed ±2SD.
Type of error: Systematic error.
Action: Reject the run and investigate the cause.
Example: Three consecutive days: +2.3SD, +1.0SD, and +2.4SD. Since two results are above +2SD, the 2 of 3 2s rule is triggered.
6.8. The 7T Rule: Trend, Increasing or Decreasing Pattern
Definition: Seven consecutive control results show a continuous increase or decrease, meaning each result is higher or lower than the previous one.
Type of error: Trend error.
Action: Investigate gradual causes of error, such as reagent deterioration, lamp aging, gradual temperature change, or other system-related conditions.
6.9. The 6x, 8x, 9x, 10x, 12x, and 15x Rules: Long-Term Bias
All of these rules are based on one shared concept: several consecutive control results are all located on the same side of the mean, even if they are still within ±1SD.
- 6x Rule: Six consecutive results on one side of the mean.
- 8x Rule: Eight consecutive results on one side of the mean.
- 9x Rule: Nine consecutive results on one side of the mean.
- 10x Rule: Ten consecutive results on one side of the mean.
- 12x Rule: Twelve consecutive results on one side of the mean.
- 15x Rule: Fifteen consecutive results on one side of the mean.
Interpretation: The higher the number of consecutive results, the greater the probability of a persistent bias, such as calibration shift, defective reagent, or a constant pipetting error. In such cases, the system should be fully reviewed.
7. Practical Summary: How Should Westgard Rules Be Used in the Laboratory?
To answer the question of what the practical application of Westgard Rules is, the following steps can be considered a simple algorithm:
- 1. Perform internal quality control regularly using at least two control levels: normal and pathological.
- 2. Record control results in Excel or dedicated QC software.
- 3. Calculate the mean, SD, and CV, and create a Levey–Jennings chart.
- 4. Review the daily pattern of points on the chart and apply Westgard Rules.
- 5. If any rule is triggered, identify and correct the cause of error before reporting patient results.
✅ Final conclusion: Knowing what Westgard Rules are and how they are applied to the Levey–Jennings chart transforms your laboratory from a simple testing unit into a quality management center capable of competing with international standards.
Frequently Asked Questions About Westgard Rules
1. What are Westgard Rules and why are they important in the laboratory?
Westgard Rules are a set of statistical rules used to interpret internal quality control results on a Levey–Jennings chart. These rules help detect random, systematic, and trend-related errors and prevent incorrect results from being reported to patients. Without these rules, quality control would be limited to simple numerical recording.
2. What is the relationship between the Levey–Jennings chart and Westgard Rules?
The Levey–Jennings chart is where quality control results are plotted, and the Mean and SD lines serve as references. Westgard Rules rely on the patterns of point placement on this chart. Therefore, to use Westgard Rules correctly, the Levey–Jennings chart must be properly created.
3. What is the 1-2s rule in Westgard Rules and when should we be concerned?
The 1-2s rule is triggered when one control result exceeds the ±2SD limit. This rule is an initial warning and does not necessarily require rejection of the analytical run by itself, but subsequent controls should be evaluated carefully to determine whether the error persists.
4. What type of error does the 1-3s rule indicate in quality control?
The 1-3s rule is triggered when one control result exceeds the ±3SD limit. This situation usually indicates a severe random error, and the analytical run should be rejected and investigated.
5. What is the 2-2s rule in Westgard Rules and when is it used?
In the 2-2s rule, two consecutive control results are on the same side of the mean and both exceed ±2SD. This situation indicates systematic error or bias. In such cases, the analytical run should be rejected and calibration, reagents, and analyzer conditions should be reviewed.
6. How does the R-4s rule help detect random error?
The R-4s rule is triggered when, in a single analytical run, the difference between two control results, such as normal and pathological controls, is greater than 4SD, with one result above and the other below the mean. This pattern indicates random error and is usually related to pipetting, sample handling, or operator problems.
7. What is the 7T rule in Westgard Rules and how does it indicate a trend?
The 7T rule is triggered when seven consecutive control results continuously increase or decrease. This pattern indicates a trend error, which may be caused by gradual reagent deterioration, temperature change, lamp aging in the analyzer, or other gradual factors.
8. Which Westgard Rules are used to identify long-term bias?
Rules such as 6x, 8x, 9x, 10x, 12x, and 15x are triggered when several consecutive control results are all on the same side of the mean. This indicates a persistent bias, even if the results are within ±1SD, and is commonly related to calibration shift or defective reagents.
9. Can Westgard Rules be applied manually without software?
Yes. If the Levey–Jennings chart is created in Excel and the Mean and SD are calculated, Westgard Rules can also be applied manually to the pattern of points. However, dedicated QC software greatly improves the speed and accuracy of interpretation.
10. What is the best way to learn Westgard Rules practically?
The best way is to use real quality control datasets, create Levey–Jennings charts in Excel or QC software, and practice interpreting different patterns using Westgard Rules. Combining theoretical study with practical exercises helps these concepts become firmly established.
Reliable References for Further Study on Westgard Rules
“`